Project information
- Category: Data Analysis & Visualization
- Project date: July2024 - Current
- Project URL: Excel Dashboards
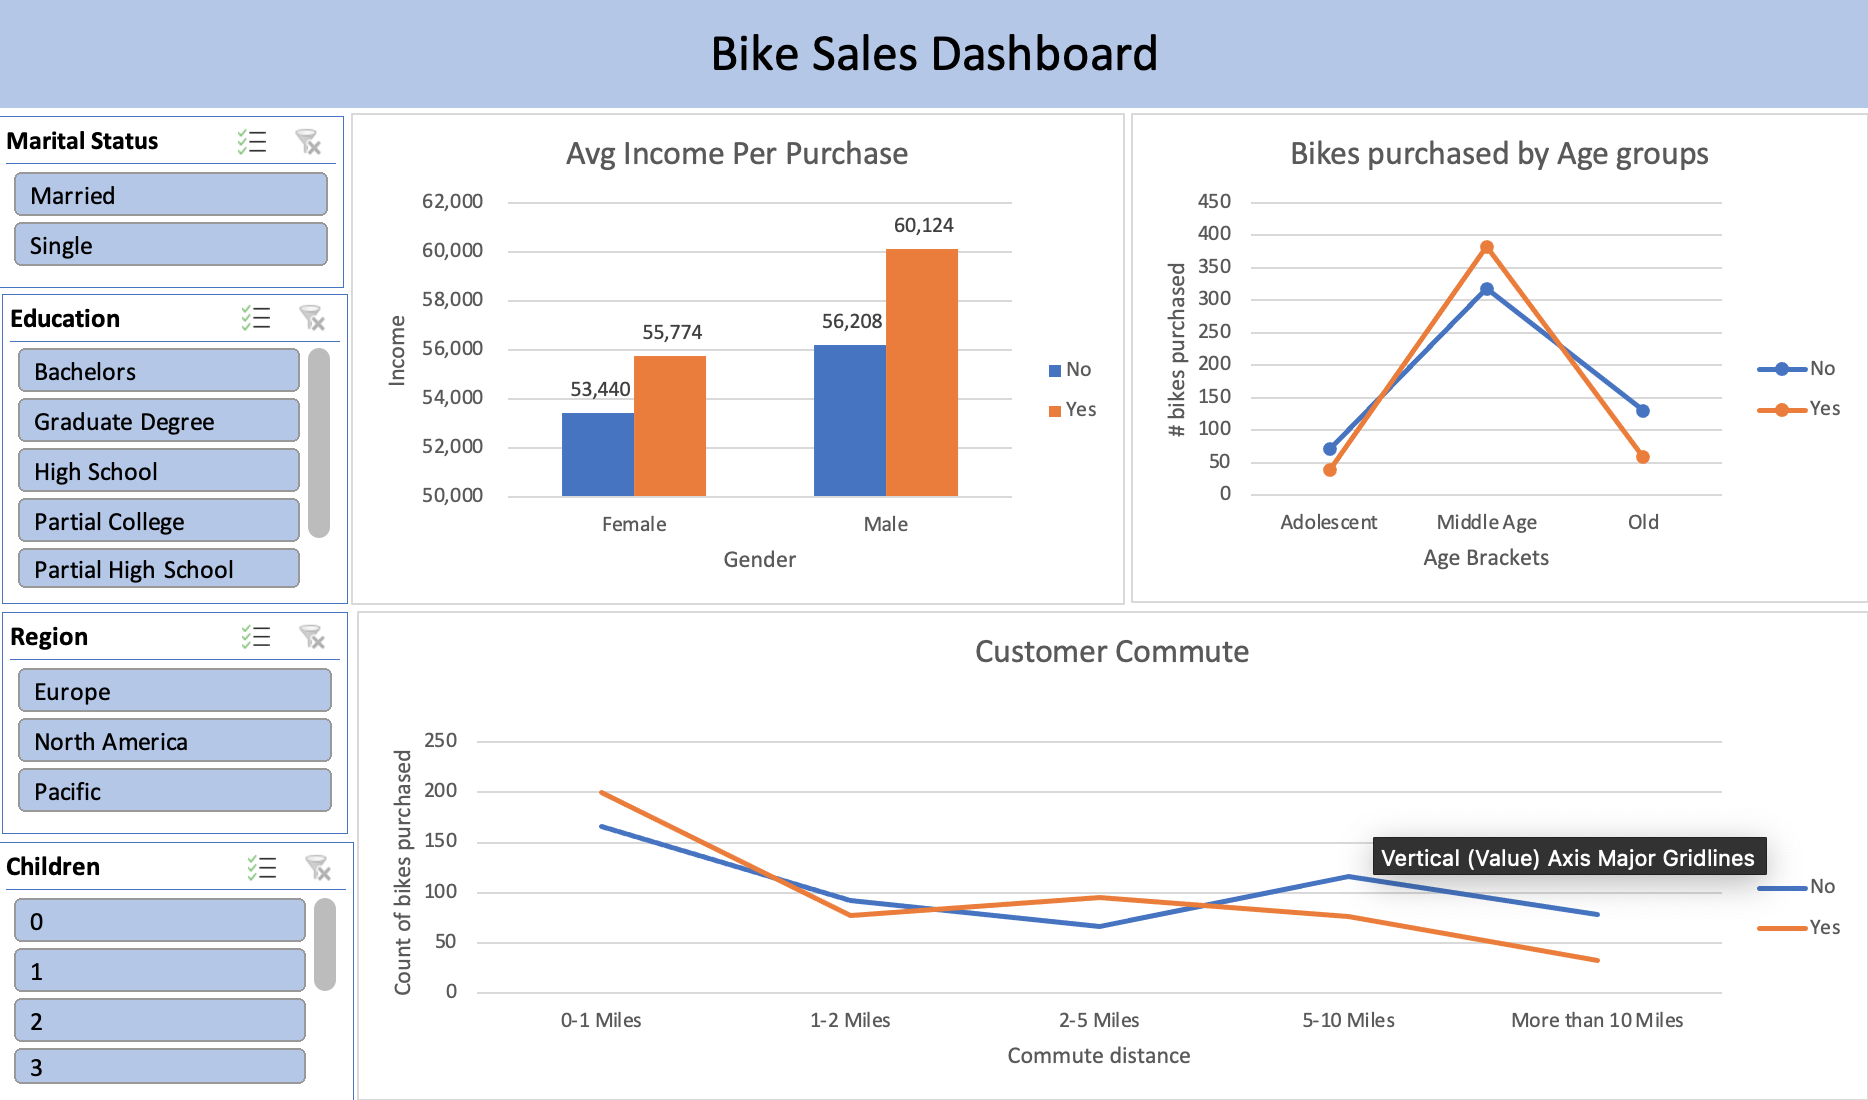
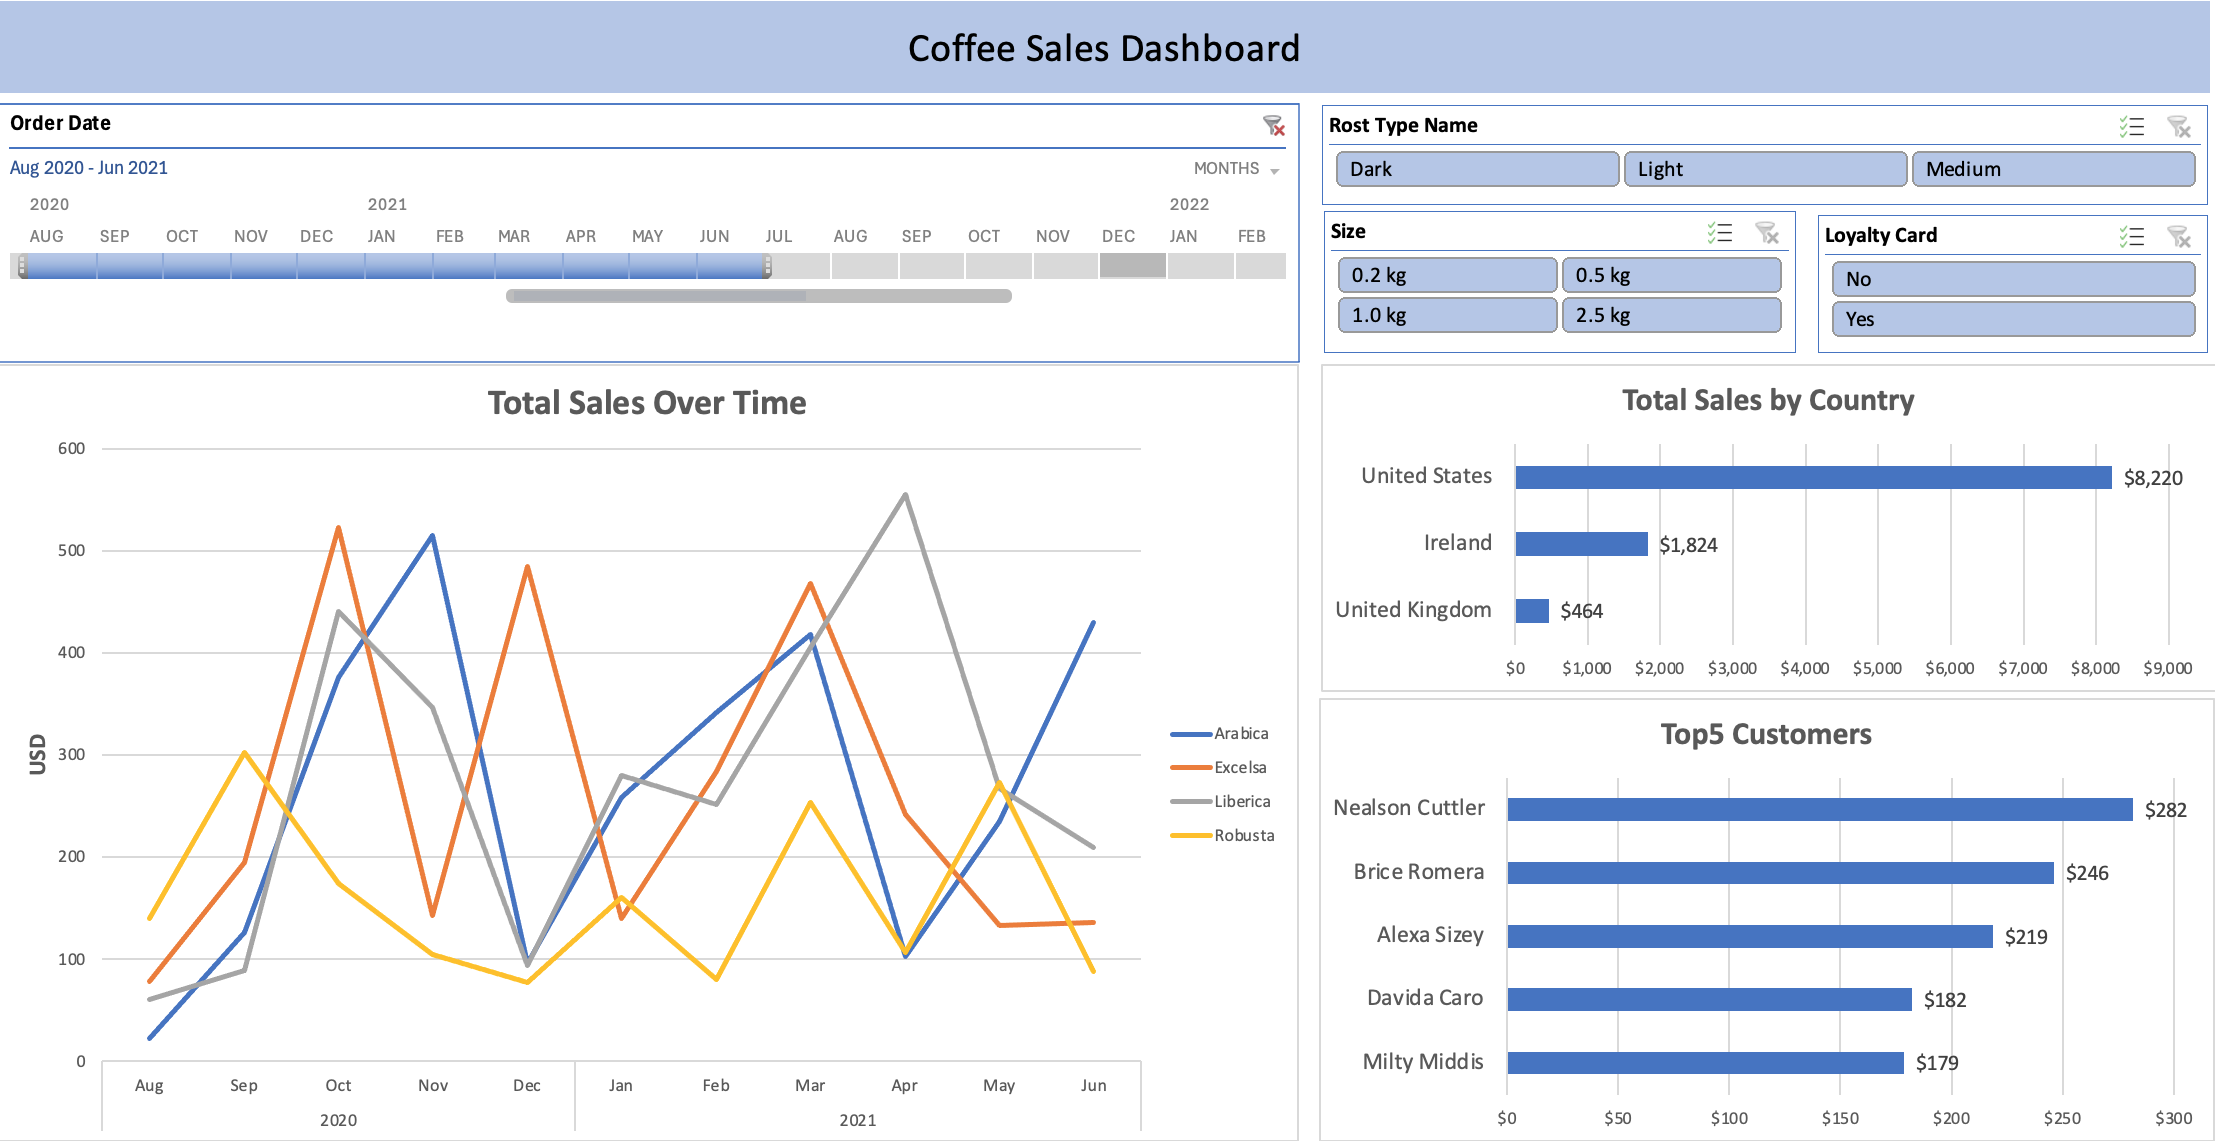
Excel Dashboards
Developed a series of interactive and visually compelling Excel dashboards across various domains, including sales, finance, and customer analytics. These projects involved working with complex datasets, applying advanced Excel functions such as XLOOKUP, VLOOKUP, SUMIF, COUNTIF, IFERROR, and INDEX-MATCH, and creating dynamic visualizations to derive actionable insights. By leveraging Pivot Tables, Slicers, and Dropdown Menus, I enhanced the interactivity of the dashboards, allowing users to filter and drill down into specific data points easily. These dashboards provides key insights into metrics like sales performance, customer behavior, and financial indicators, demonstrating how Excel can be used as a powerful tool for data analysis, visualization, and business intelligence.